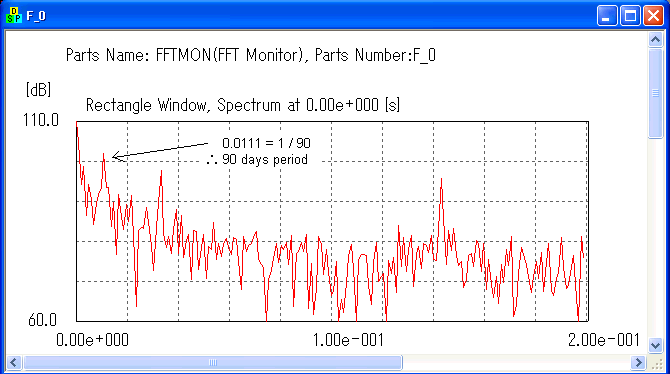
 Let's analyze the spectrum. You may see a peak at 0.1428[Hz]. That means
the chart has that frequency i.e. a sine wave which has 7 days period. Let's analyze the spectrum. You may see a peak at 0.1428[Hz]. That means
the chart has that frequency i.e. a sine wave which has 7 days period.

 You may also see a peak at 0.0333[Hz]. That means the chart has that frequency
i.e. a sine wave which has 30 days period. You may also see a peak at 0.0333[Hz]. That means the chart has that frequency
i.e. a sine wave which has 30 days period.

 And you may see a peak at 0.0111[Hz]. That means the chart has that frequency
i.e. a sine wave which has 90 days period. And you may see a peak at 0.0111[Hz]. That means the chart has that frequency
i.e. a sine wave which has 90 days period.

 So we have found three type of sine wave in the chart. Their periods are
7days, 30days and 90days. So we have found three type of sine wave in the chart. Their periods are
7days, 30days and 90days.
 That means there might be something to take effect on the stock price which
occurs every one week, every one month and every three month. That means there might be something to take effect on the stock price which
occurs every one week, every one month and every three month.
|


