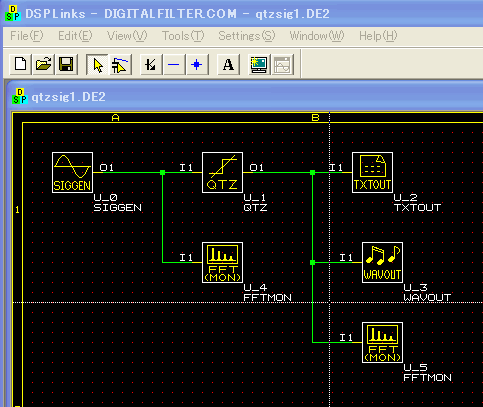
 Then you see a schematic like following. This is to quantize an input signal. Then you see a schematic like following. This is to quantize an input signal.
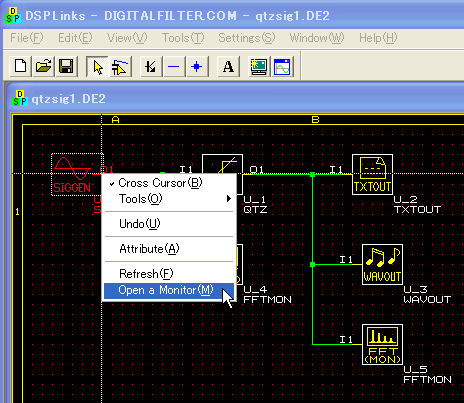
 Do left click to select SIGGEN (U_0) and right click to choose "Open
a Monitor". Do left click to select SIGGEN (U_0) and right click to choose "Open
a Monitor".
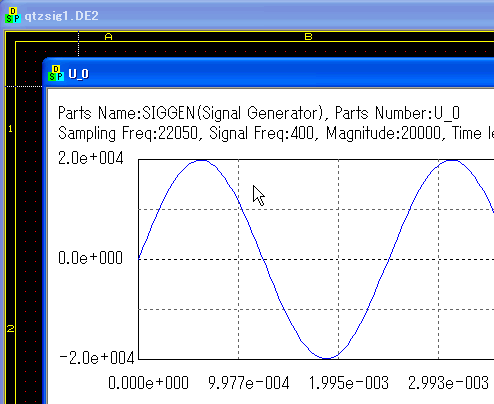
 This generates a sine wave which frequency is 400Hz. This generates a sine wave which frequency is 400Hz.
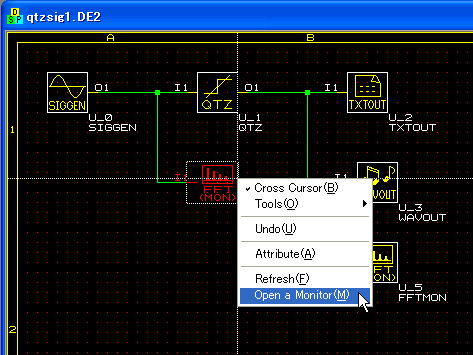
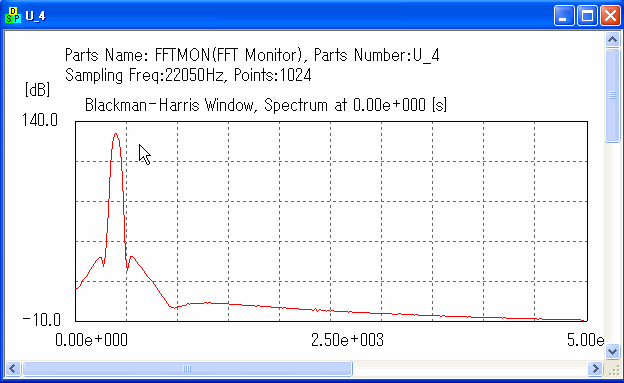
 Next, open a monitor for FFTMON (U_4) to see its spectrum. Next, open a monitor for FFTMON (U_4) to see its spectrum.
 The spectrum has a peak at 400Hz and the floor noise is -120dB below compare to the peak. That means SNR (Signal to Noise Ratio) is about 120dB. The spectrum has a peak at 400Hz and the floor noise is -120dB below compare to the peak. That means SNR (Signal to Noise Ratio) is about 120dB.
|


