 Please complete the last class before this class. Please complete the last class before this class.
 We execute FFT on the chart of stock price. Please understand how to analyze
the spectrum and how "Moving Average" (M.A.) changes the spectrum. We execute FFT on the chart of stock price. Please understand how to analyze
the spectrum and how "Moving Average" (M.A.) changes the spectrum.
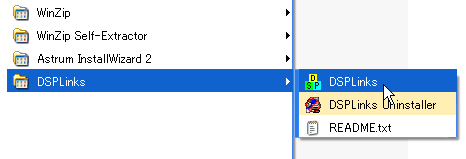
 Please start "DSPLinks". Please start "DSPLinks".

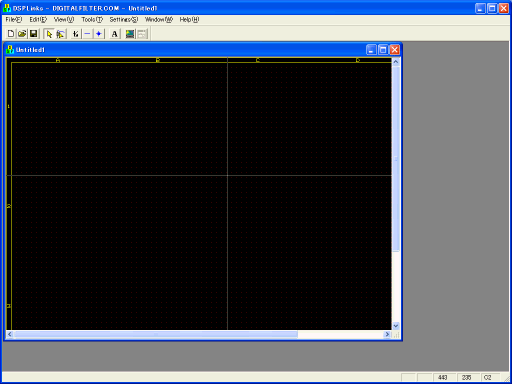
 Then you see a blank schematic like following. Then you see a blank schematic like following.

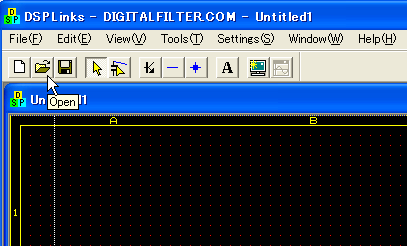
 Please click on "Open icon" to open an existing schematic. Please click on "Open icon" to open an existing schematic.

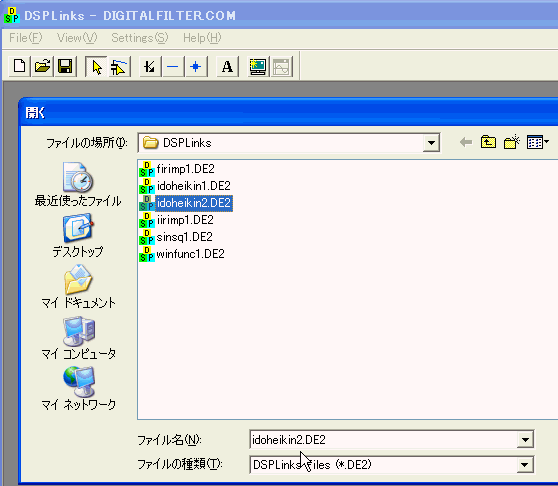
 Open "idoheikin2.DE2", which should reside in the directory DSPLinks
was installed. Open "idoheikin2.DE2", which should reside in the directory DSPLinks
was installed.

|


