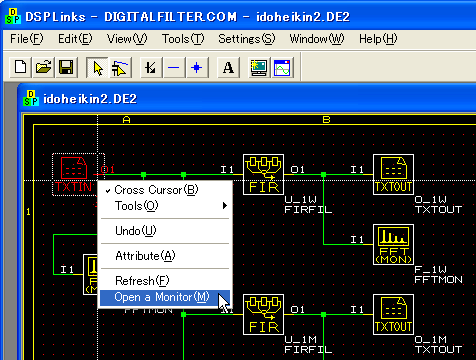
 Then you will see a schematic like this. Then you will see a schematic like this.

 Do left-click to select TXTIN then right click to choose "Open a Monitor". Do left-click to select TXTIN then right click to choose "Open a Monitor".

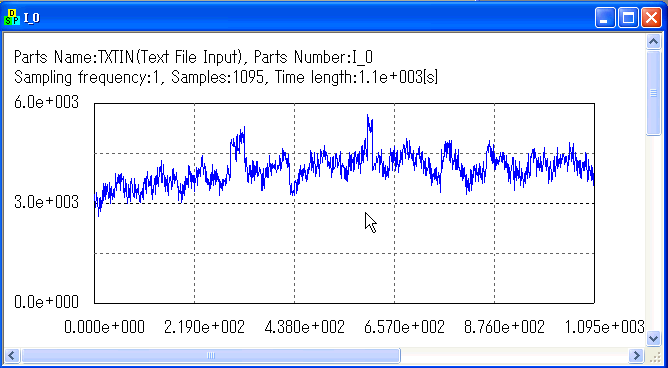
 This is a raw chart of stock price. This data consists of 1095 days (3
years). This is a raw chart of stock price. This data consists of 1095 days (3
years).

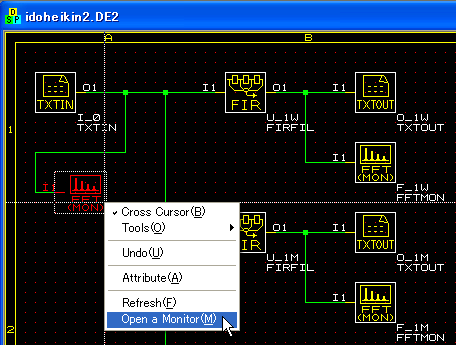
 And please do the same thing for FFTMON(F_0), which stands for Fast Fourier
Transform Monitor. And please do the same thing for FFTMON(F_0), which stands for Fast Fourier
Transform Monitor.

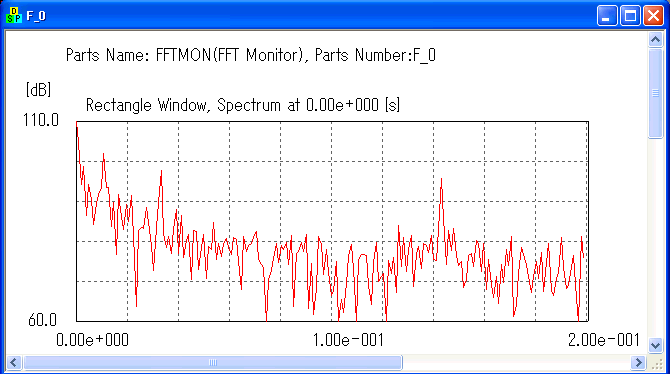
 Then the FFT is executed and the window shows you a spectrum. Then the FFT is executed and the window shows you a spectrum.

|


