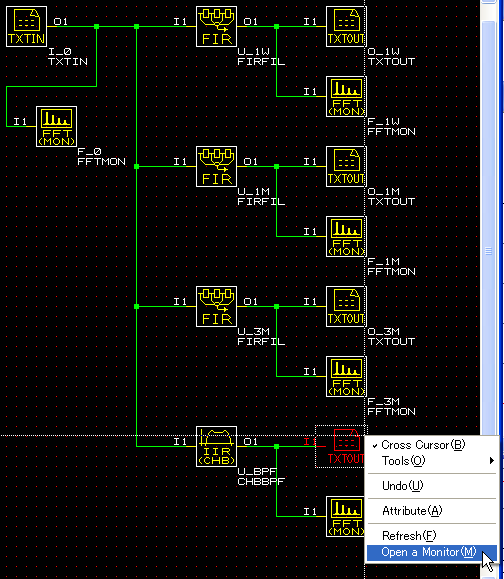
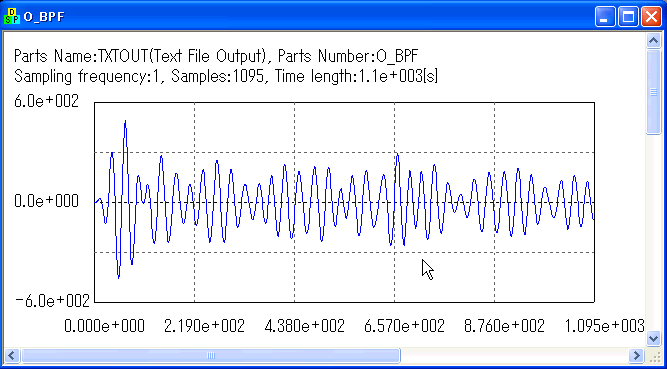
 Let's take a look at TXTOUT(O_BPF) to see filtered output. Let's take a look at TXTOUT(O_BPF) to see filtered output.

 This is what 0.0333Hz is!! This wave was hidden in the chart but we have
picked it up by a Band Pass Filter. This is what 0.0333Hz is!! This wave was hidden in the chart but we have
picked it up by a Band Pass Filter.

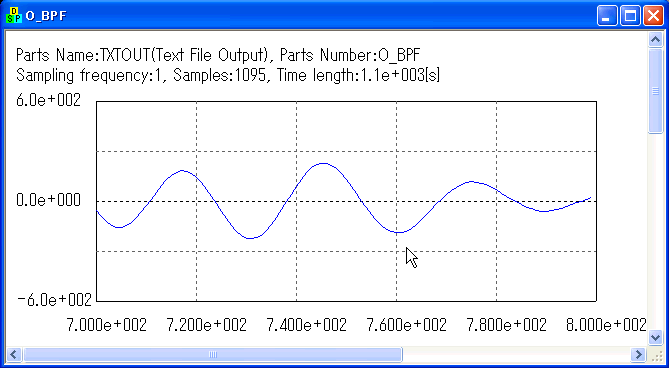
 You can change the scale by "View" -> "Scale Change"
and check this wave's one period is 30 days. You can change the scale by "View" -> "Scale Change"
and check this wave's one period is 30 days.

 That's it for this class. FFT is very strong tool to analyze a series of data. Digital Filter is also very strong tool to remove unnecessary information and even to pick up some hidden information. That's it for this class. FFT is very strong tool to analyze a series of data. Digital Filter is also very strong tool to remove unnecessary information and even to pick up some hidden information.
|


