 And next, open a monitor for FIRFIL(U_3M). And next, open a monitor for FIRFIL(U_3M). 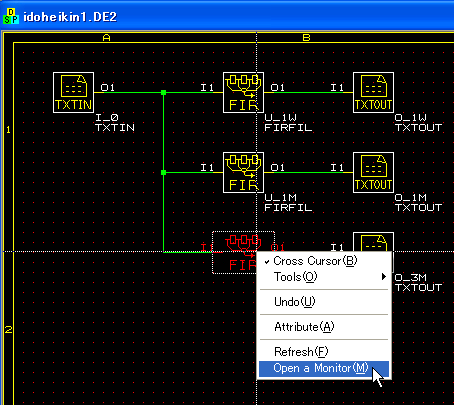 The frequency response of 90days (3month) M.A. is drawn like this. The frequency response of 90days (3month) M.A. is drawn like this.  Then please open a monitor for TXTOUT(O_3M). Then please open a monitor for TXTOUT(O_3M). 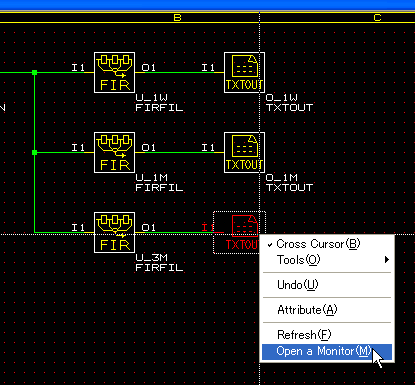 The window shows you a stock chart filtered by 90days M.A. The window shows you a stock chart filtered by 90days M.A. 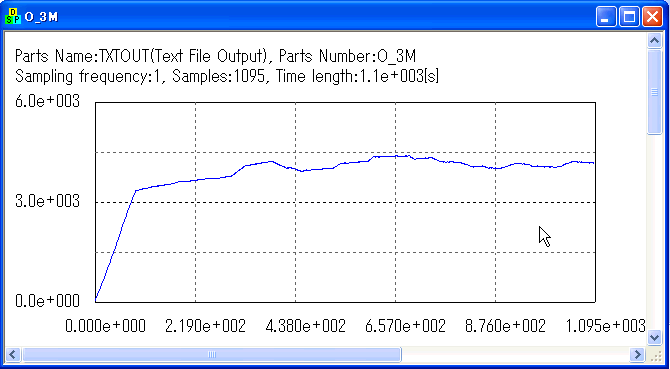 You can save the filtered output by choosing "Tools" -> "Save Text". That should be "stockout3m.txt". You can save the filtered output by choosing "Tools" -> "Save Text". That should be "stockout3m.txt". 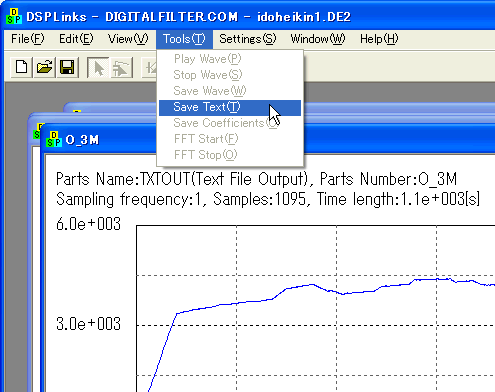
|
Top Page