 Let's see the raw stock chart again. There are some high frequencies on
this. Let's see the raw stock chart again. There are some high frequencies on
this.

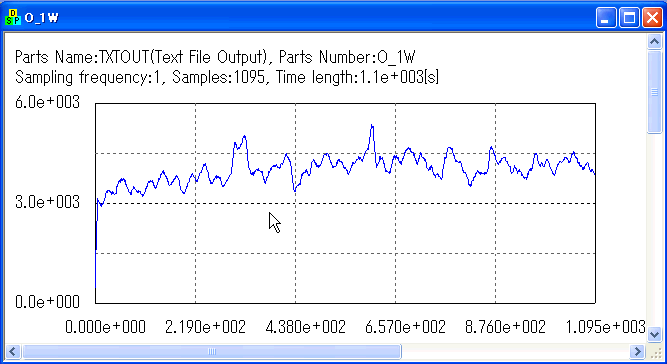
7days moving average cuts high frequencies. Coefficients of FIRFIL(U_1W)
consist of 7 lines and every value is 1/7 = 0.143. (See "coeff1w.txt")
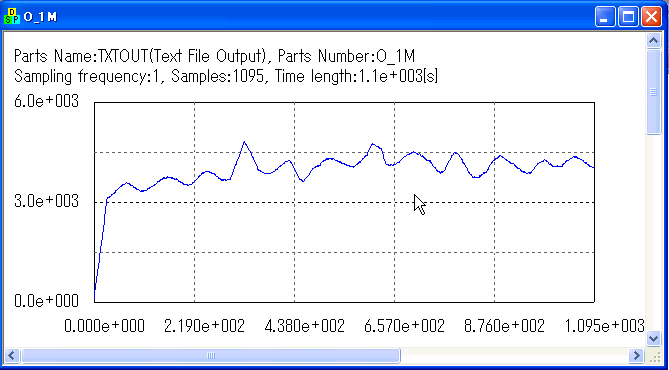
30days moving average cuts mid-high frequencies. Coefficients of FIRFIL(U_1M)
consist of 30 lines and every value is 1/30 = 0.0333. (See "coeff1m.txt")
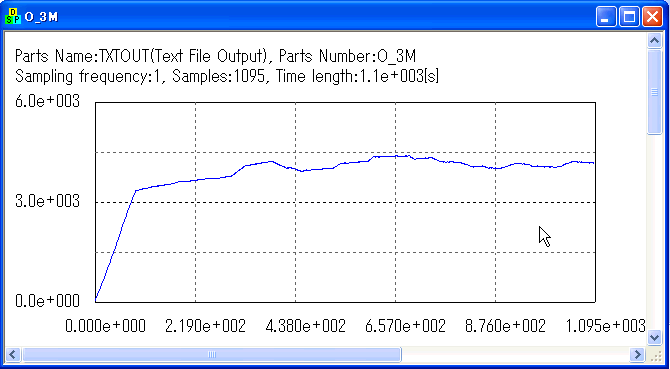
90days moving average cuts mid-high and even some low frequencies. Coefficients
of FIRFIL(U_3M) consist of 90 lines and every value is 1/90 = 0.0111. (See
"coeff3m.txt")
Please understand that Moving Average is a sort of digital filter and that
cuts relatively high frequencies and leaves low frequencies. If you make
Xdays moving average, coefficients of the filter consist of X lines and
every value is "1/X". For example, see 14days, 60days and 180days moving average.
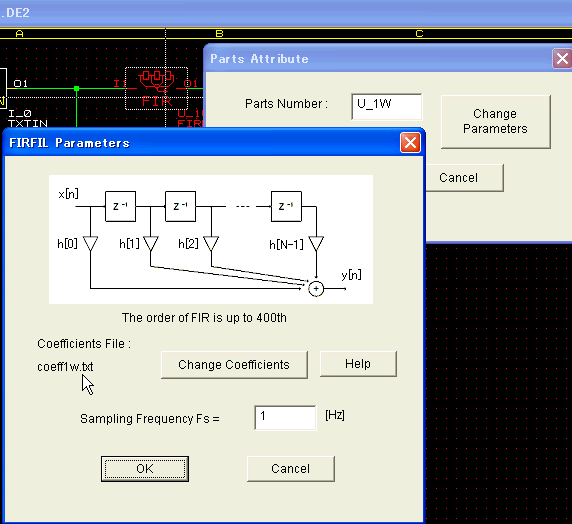
To change the coefficients file, please double-click FIRFIL then click
"Change Parameters" and "Change Coefficients".
That's it for this class. In the next class, we will execute FFT on the stock chart and analyze it.
|